
The Economy & Strategies
Second Half 2024 Viewpoint
Jul 1, 2024
By
Thomas Goho
We provide investment banking, research, sales and trading, asset and wealth management, public finance, insurance, private capital, and family office services.
We are a family-owned financial services firm that values client relationships, long-term stability, and supporting the communities where we live and work.
The idea of family defines our culture, because each of us knows that our reputation is on the line as if our own name was on the door.
Our reputation as a leading independent financial services firm is built on the stability of our longstanding and highly experienced senior executives.
We are committed to corporate philanthropy; economic and financial literacy advocacy; and diversity, equity, and inclusion initiatives.
Stephens is proud to sponsor the PGA TOUR, LPGA Tour, and PGA TOUR Champions careers, as well as applaud the philanthropic endeavors, of our Brand Ambassadors.
We host many highly informative meetings each year with clients, industry decision makers, and thought leaders across the U.S. and in Europe.
We provide fiduciary investment strategies to public-and private-sector institutional clients through asset allocation, consulting, and retirement services.
Decades of proven performance and experience in providing tailored fixed income trading and underwriting services to major municipal and corporate issuers.
Proven industry-leading research, global market insights, and client-focused execution.
Customized risk management, property & casualty, executive strategies and employee benefits solutions that protect our clients over the long term.
We assist companies with accessing capital through innovative advisory and execution services that help firms achieve their strategic goals.
We have been a trusted and reliable source of capital for private companies for over 70 years.
Our experienced Private Client Group professionals develop customized investment strategies to help clients achieve their financial goals.
We are a trusted municipal advisor with proven expertise in public financings. We also work with clients in negotiated and competitive municipal underwritings.
In the mid-20th century Samuel Beckett wrote the play “Waiting for Godot” in which the two main characters endlessly await Godot’s arrival. But Godot never comes. In recent months, economists, Fed watchers and other pundits have been sitting by their Bloomberg terminals “Waiting for Rate Cut” which has yet to come.
This issue of Viewpoint will:
Economic Growth
U.S. economic growth remains healthy and near its potential considering America’s economic and financial resources. We at Stephens have not been expecting a recession, but we have been surprised by the intrinsic strength of the economy. In the four quarters of 2023, the economy grew between 2.1% and 4.9% and averaged 2.5% for all of 2023. And in the first quarter of 2024, GDP growth was 1.3%, which was sub-par but not recessionary. (See Figure 1.)
Figure 1: Real Gross Domestic Product (Real GDP) Growth, 2021 to Present. Quarterly Data.
Source: Federal Reserve Bank of St. Louis. Extracted from the Federal Reserve Economic Database (Based on U.S. Bureau of Economic Analysis data).
The Federal Reserve Bank of Atlanta, using its GDPNow model, is now forecasting growth of 3.1% for the second quarter of 2024, which is higher than the expectation of the BlueChip Forecasts. (See Figure 2.)
Figure 2: Atlanta Fed GDPNow and the BlueChip Forecasts of Economic Growth for the Second Quarter of 2024.
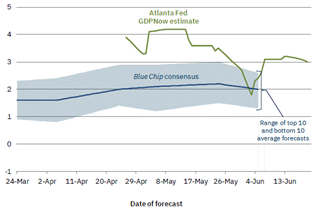
Source: Federal Reserve Bank of Atlanta. “GDPNow Forecast”. June 20, 2024. (Based on the Atlanta Fed’s analysis and that of Blue-Chip Financial Forecasts).
The Federal Reserve Bank of Philadelphia produces a survey of 34 professional forecasters. These economists and financial institutions now expect quarterly growth in the range of 1.5% to 2.1%. (See Figure 3.) For the second quarter of 2024, these forecasters revised upward their previous forecast. It is notable that since November 2023 their average second quarter growth forecast increased from a tepid rate of .7% to a reasonably solid 2.1% in May 2024.
Figure 3: 2024 Quarterly Real GDP Estimates by Professional Forecasters
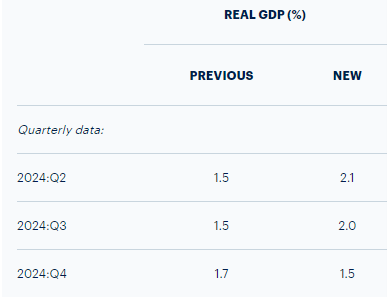
Source: Federal Reserve Bank of Philadelphia. “Survey of Professional Forecasters: Second Quarter of 2024.” May 10, 2024. Page 1.
The full-year growth forecast for 2024 is 2.5%, an upward revision from 1.7% in November 2023. A useful counterpoint to the Philadelphia Survey is the Wall Street Journal forecast of 78 professional economists. Its May 2024 survey expected second quarter real GDP of 1.6% and full year 2024 growth of 1.7%, clearly lower than either the Philadelphia survey or the Atlanta Federal Reserve forecasts.
Best Guess About Economic Growth
Individuals and institutions “Waiting for Recession” will be disappointed in 2024. We at Stephens retain our ongoing optimism that this economy possesses a foundational strength that will generate growth of about 2% in 2024. America’s core strength in 2024 is and will continue to be its labor markets.
Labor Markets
American employment is at or very near the Federal Reserve’s mandated goal of full employment. The unemployment rate in May 2024 was 4.0%, slightly higher than the 3.9% in April but still at or near full employment. (See Figure 4.)
Figure 4: Monthly U.S. Unemployment, 2021 to Present, Seasonally Adjusted.
Source: Federal Reserve Bank of St. Louis. Extracted from the Federal Reserve Economic Database (Based on U.S. Bureau of Labor Statistics).
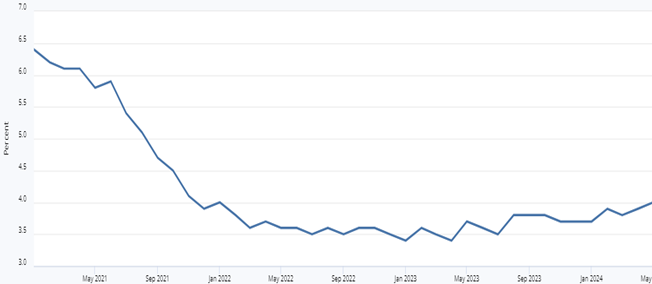
For many individuals with a short-term focus, it is easy to lose track of just how good a 4% unemployment rate is. (See Figure 5.) The last time unemployment was at this low rate for an extended period was in the late 1960s. That period was notable for the significant expansion of Great Society programs as well as massive spending on the Vietnam War.
Figure 5: U.S. Unemployment Rate, 1950 to Present, Seasonally Adjusted.
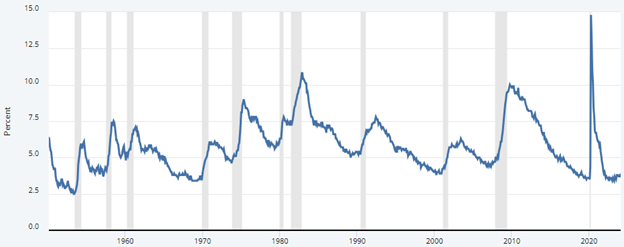
Note: Shaded areas indicate recessions.
Source: Federal Reserve Bank of St. Louis. Extracted from the Federal Reserve Economic Database (Based on U.S. Bureau of Labor Statistics).
Prior to the Covid pandemic, the Congressional Budget Office (CBO) considered the non-inflationary full employment rate to be about 4.6%. This rate is known as the “non-accelerating inflation rate of unemployment,” referred to as NAIRU is expected. The Federal Reserve Bank of St. Louis’s NAIRU to be between 4% and 5% in the current environment, a rate not inconsistent with the CBO’s estimate.
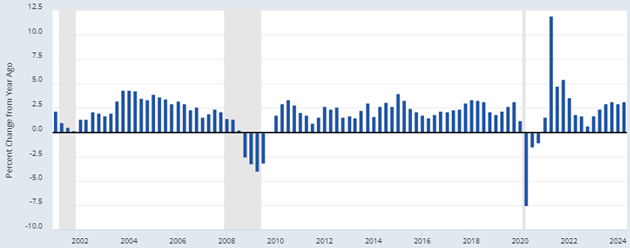
In brief, the American employment/unemployment situation is healthy by most economic standards. Other indicators show strong labor market conditions. The number of job openings compared to the number of unemployed workers indicates that there are substantially more job openings than the number of unemployed workers. (See Figure 6.)
Figure 6: The Number of Jobs Openings (dash line) Compared to the Number of Unemployed Workers, 2001 to 2024.
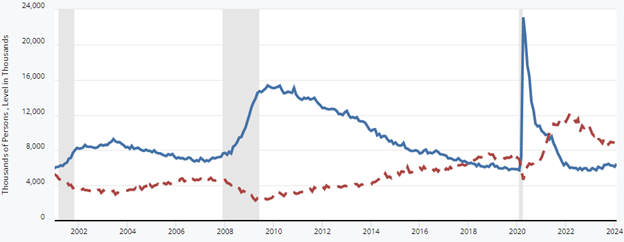
Note: Shaded areas indicate recessions.
Source: Federal Reserve Bank of St. Louis. Extracted from the Federal Reserve Economic Database (Based on U.S. Bureau of Labor Statistics).
In general, it is uncommon in recent decades to have more job openings relative to the number of unemployed workers. The job openings data suggest that the unemployment rate is unlikely to spike much higher in the coming quarters.
Best Guess About Labor Markets
We at Stephens are optimistic that unemployment will remain low and at levels unlikely to presage a slide into recession. We expect that the unemployment rate will reach no higher than 4.25% for the remainder of 2024 and into early 2025. One condition that could derail low unemployment would be an extended shutdown of the U.S. government caused by congressional gridlock, which could ripple across the economy.
Prices and Inflation
The Federal Reserve has two congressionally mandated responsibilities: full employment and stable prices. As noted above, the Fed has aided in the achievement of its employment goal. Its success in meeting the stable price mandate is far from certain. Prices since the start of the Covid pandemic have been on a roller coaster ride. (See Figure 7.) Price increases in less than 4 years have gone from about 0% in mid-2020 to 9% in 2022 and now down to 3% in mid-2024, hardly stable prices.
Figure 7: Consumer Price Index for All Urban Consumers, All Items (Year-Over-Year Change), 2020 to Present.
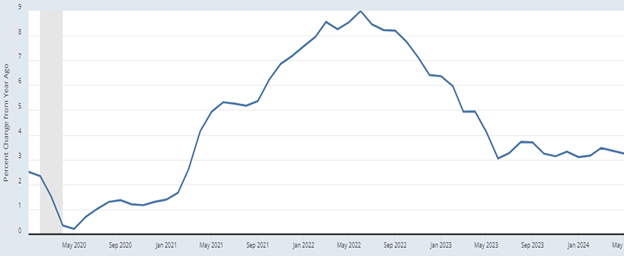
Note: A shaded area indicates a recession.
Source: Federal Reserve Bank of St. Louis. Extracted from the Federal Reserve Economic Database (Based on U.S. Bureau of Labor Statistics).
The headline inflation report of the all-inclusive Consumer Price Index (CPI) indicates that the Federal Reserve still has work to do on the price front. Its inflation goal of 2% remains elusive. However, the Fed focuses on a different measure of inflation: the Personal Consumption Expenditures Price Index (PCE). That index indicates that price volatility has occurred over the past 4 years but not as severely as the headline CPI. (See Figure 8.) In that period the PCE moved from about minus 1% to 6% in early 2022, and it is now only slightly higher than its 2% target at 2.1%.
Figure 8: Personal Consumption Expenditures (PCE) Excluding Food and Energy, 2020 to Present (Quarterly Data).
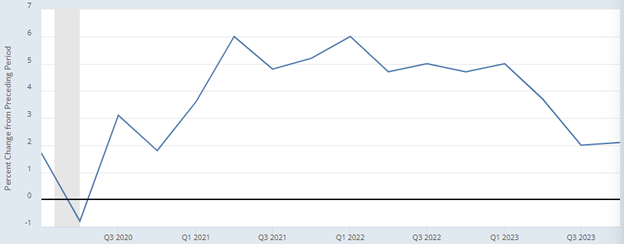
Note: A shaded area indicates a recession.
Source: Federal Reserve Bank of St. Louis. Extracted from the Federal Reserve Economic Database (Based on U.S. Bureau of Economic Analysis data).
The Fed’s preferred price index might suggest that the Fed will soon cut its target interest rates. In fact, the financial markets have expected interest rate cuts for months. A deeper examination of inflation, however, suggests that the Fed’s hesitancy to cut interest rates is well-founded.
One indication of inflation’s obstinacy is a sub-set of prices that have remained elevated in recent months despite the Fed’s tight monetary policy. (See Figure 9.) The Atlanta Fed’s comparison of sticky prices versus flexible prices indicates the stubbornness of a significant portion of consumers’ shopping items. Sticky prices, which represent 70% of the typical shopping basket, include auto insurance premiums, apartment rents, and newspaper subscriptions, among many others. These prices are still increasing at an annual rate of 4.5%.
The remaining 30%, flexible prices, include gasoline, agricultural products and others. These prices behave the way economists expect during periods of tight monetary policy. They are now about zero after increasing in 2022 by close to 20%. On balance, inflationary pressures persist, and the Fed knows it: thus, its cautious approach to cutting interest rates.
Figure 9: Core Flexible (dark line) Versus Sticky CPI (dash line) Prices, 2020 to Present.
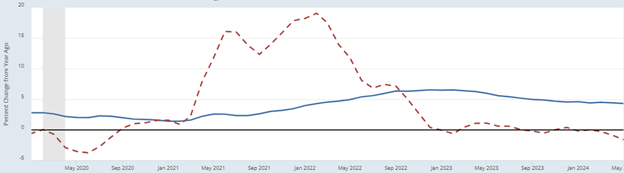
Note: A shaded area indicates a recession.
Source: Federal Reserve Bank of Atlanta. “Sticky-Price CPI.” April 10, 2024.
Another related manifestation of inflation is the ongoing increases in service prices which are partially included in the measure of sticky prices. (See Figure 10.) Between early 2021 and early 2023 service prices increased from 1.25% to 7.25%. Service prices are still elevated at 5.4%.
Figure 10: Consumer Price Index (CPI): Services Excluding Energy Service Prices, 2020 to Present.
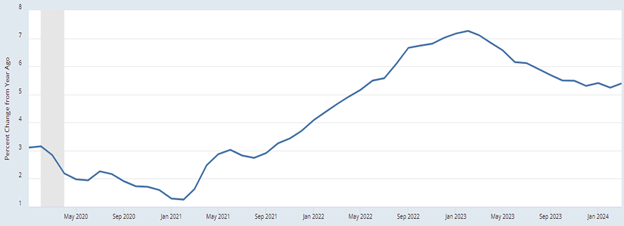
Note: A shaded area indicates a recession.
Source: Federal Reserve Bank of St. Louis. Extracted from the Federal Reserve Economic Database (Based on U.S. Bureau of Labor Statistics).
The Federal Reserve’s decision-making arm, the Federal Open Market Committee (FOMC), understands that inflation is still a problem, and has no immediate need for interest rate reductions.
Best Guess About Inflation
Intrinsic inflation is above the Fed’s target inflation rate of 2%. Beyond the headline data, serious inflation problems exist. Inflation will not reach the Fed’s target until at least early 2025 when both broad measures like the CPI and narrow measures like service price inflation may begin to reach levels acceptable to the Federal Reserve. We at Stephens expect core inflation to remain elevated at 2.25% to 2.50% for the remainder of 2024.
Monetary Policy
The Federal Reserve decision-makers were instrumental in normalizing economic growth and employment after Covid. Yet, they waited far longer than was prudent in initiating monetary tightening. The Fed should probably have started rate increases at least 9 months earlier than it did to dampen inflationary pressures. But starting in March 2022, the Federal Open Market Committee (FOMC) acted aggressively to raise target rates from about zero to 5.5%. (See Figure 11.)
Figure 11: Effective Federal Funds Rate, 2010 to Present
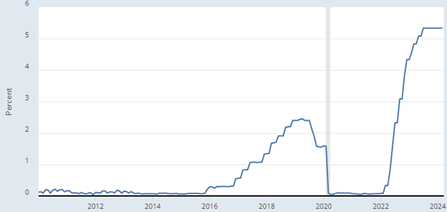
Note: A shaded area indicates a recession.
Source: Federal Reserve Bank of St. Louis. Extracted from the Federal Reserve Economic Database (Based on data from the Federal Reserve Bank of New York).
The Federal Reserve’s aggressive action on short-term interest rates has also impacted longer-term rates, especially mortgage rates. (See Figure 12.) Higher mortgage rates had the Fed’s desired effect of slowing the American housing market as measured by new housing construction.
Figure 12: 30-Year Fixed Rate Mortgage Average in the United States, 2020 to Present.
Source: Federal Reserve Bank of St. Louis. Extracted from the Federal Reserve Economic Database (Based on data from Freddie Mac).
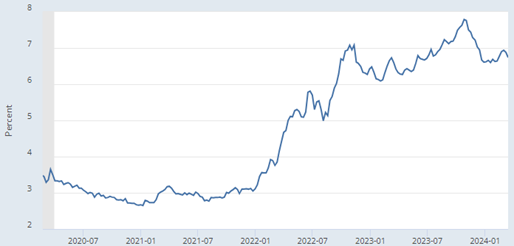
This increase in long-term rates has not only affected borrowing costs for new homes but also for old houses. These rate increases also raised borrowing costs on U.S. government debt. The cost of newly issued 10-year Treasury debt increased from under 1% to the current 4.2%. (See Figure 13.)
Figure 13: Yield on 10-Year U.S. Treasury Securities, 2020 to Present.
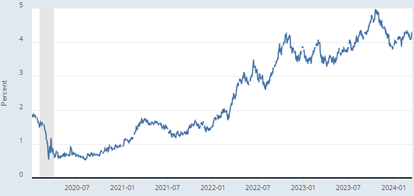
Note: A shaded area indicates a recession.
Source: Federal Reserve Bank of St. Louis. Extracted from the Federal Reserve Economic Database (Based on data from the Board of Governors of the Federal Reserve System).
As short-term U.S. government debt matures, the government will need to re-issue debt at higher interest rates to fund its operations. Total interest expenses will begin to increase, thereby worsening the federal deficit. The Federal Reserve is acutely aware of this fact. The longer the Fed maintains high interest rates, the larger the interest expense in the federal budget.
Best Guess About Monetary Policy
The Fed’s FOMC will likely cut interest rates no more than once between now and the end of 2024. Strong labor markets and average economic growth will preclude significant cuts in the Fed’s target interest rate. Market participants who expect much more aggressive cuts in the Fed’s target interest rates will be disappointed. At a recent press conference after the Fed board meeting, Chairman Jerome Powell stated the Fed will likely cut rates 3 times in 2024. This statement was ill-advised because the inflation data did not support any rate cuts. And now Chairman Powell has backtracked from that statement, instead suggesting one interest rate cut in 2024.
Remember the congressional mandate to the Federal Reserve is “stable prices.” An examination of the inflation charts above indicates that the economy is a long way from price stability. Thus, we stick with thinking that a slow retreat from high interest rates is the prudent course of action. No more than one rate cut in 2024 is the appropriate action.
U.S. Fiscal Policy
The federal budget deficit is likely to become unmanageable within the planning horizon of many investors. As Fed Chairman Jerome Powell stated recently “The U.S. federal government (is) on an unstainable fiscal path. And that just means that the debt is growing faster than the economy and therefore unsustainable.”
The Congressional Budget Office’s (CBO) analysis seems to indicate that a serious problem is getting worse very quickly. (See Figure 14.) In May 2022, the CBO’s projections indicated that the 10-year cumulative budget deficit between 2023 and 2032 would be $15.7 trillion. A mere 9 months later the CBO raised that forecasted deficit by $3.1 trillion to $18.8 trillion. About 40% of this increase was caused by new congressional legislation.
Figure 14: Changes in the Congressional Budget Office’s Baseline Projections of the 10-Year Deficit Since May 2022.
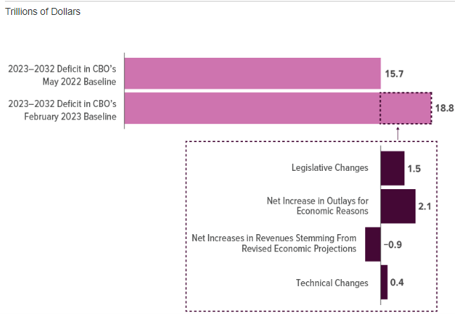
Source: U.S. Congressional Budget Office. “The Budget and Economic Outlook: 2023 to 2032.” February 2023.
To put Powell’s observation into context, the American economy is growing and will grow at a rate of roughly 2%, which is very close to its potential growth. Given the size of the American economy that means the real GDP is growing about $500 billion per year while the accumulated federal debt is growing about $1.9 trillion per year.
Much of the expected increase in deficits is directly attributable to the expansion in the share of government spending as a percent of the U.S. economy. Prior to the Covid pandemic, federal government spending consumed about 20% of real GDP. Four years after the pandemic, government spending is over 24% of GDP and is projected to stay at that level for the next 10 years. (See Figure 15.)
Figure 15: Federal Spending as a Percent of GDP Between 2014 and 2034, Actual and Projected.
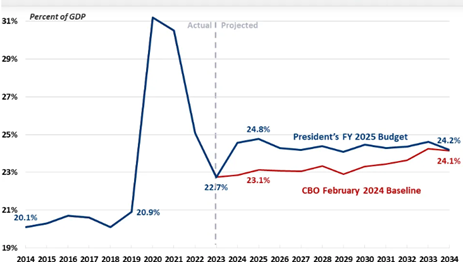
Source: Committee for a Responsible Federal Budget. “Comparing Spending Levels in the President’s 2025 Budget.” February 2024.
In a period of 5 years, the federal budget was increased from about one-fifth of the economy to about one-fourth of the economy as measured by government’s share of real GDP. Neither Democrats nor Republicans seem committed to shrinking the size of the government in the foreseeable future.
Best Guess About Fiscal Policy
Dr. Herb Stein, a former chairman of the Council of Economic Advisers, stated in 1986 that “If something cannot go on forever, it will stop.” He was referring then to the rising U.S. federal debt as a percent of real GDP. If he were still alive, he might have to rethink his dictum. In 1986 the federal debt-to-GDP ratio was 45%. At the end of 2023, it was 120%. In that same period, U.S. debt has increased from $2 trillion to $34 trillion.
We at Stephens expect there is nothing on the horizon that is likely to change the trajectory of fiscal profligacy. Herb Stein worried about it in 1986. The non-partisan Committee for a Responsible Federal Budget continues to sound the fiscal alarm. Large fiscal deficits and mounting federal debt are facts that will not change between now and the end of the decade. It’s important for astute investors to factor this disturbing situation into their asset allocation decisions.
Final Thoughts
The year-on-year strength of the U.S. economy has defied expectations as is apparent in most economic data. The next 6 to 12 months are likely to resemble the last 12 months.
The larger picture which transcends the economic conditions of the next 12 months is the massive battle that pits monetary policy against fiscal policy. Chairman Powell and the Federal Reserve Board are trying to achieve and then maintain stable monetary conditions so that it can meet its dual mandate of full employment and stable prices. Yet at the same time, fiscal policy, characterized by large budget deficits, injects massive amounts of deficit spending into the economy. This deficit spending complicates the achievement of Fed’s stable price mandate because households and businesses receive this spending power from the government’s largesse.
Those individuals and businesses that expect the world to return to the days of easy monetary policy, where interest rates are at or near zero, will be sorely disappointed in the coming years. Interest rates for the foreseeable future are poised to stay at levels that prevailed before the early 2000s. Mortgage rates, bond rates and a myriad of other borrowing rates will reflect the prevailing inflation rates. Also fixed income investments will produce positive real returns. This means that the mortgage rate will be at least 6%, and government bonds will yield at least 4% for the foreseeable future.
It is a strange world where the federal government uses the word “sustainable” in many press releases, regulations and decrees. Yet our government has an unsustainable fiscal policy, as expressed by Chairman Powell.
Americans are not waiting for Godot. They are “Waiting for Prudent Fiscal Policy.” Remember Godot never arrived and prudent fiscal policy is unlikely to make an appearance in Congress.

Thomas Goho, Ph.D. is formerly the Chief Economic Consultant for Stephens Inc. He also served as the Co-Director of Stephens University at Wake Forest University.